Cataclysmic Variable Visualizations
Here are a couple animations showing a 100,000-particle simulation with mass ration q=0.20 that is in the permanent superhumping state. The simulation is visualized at inclinations of 0 and 80 degrees, and the "bolometric" light curve is shown below the disk particles (the same system is shown at i=70 deg in the panel to the left). Note that the light curve is strongly double humped. The average light curve and Fourier transform for orbits 400-450 are included at the end of the animation. Also shown are the intersection of the Roche lobes with the x-y plane. Each is about 180 MB download and 400x400 pixels.
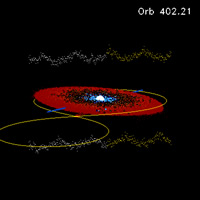 Next is a q=0.40 system undergoing negative superhumps as a result of the disk being (manually) tilted 5 degrees about the x-axis at orbit 400. The mass flux through the L1 point after the simulation restart is 1000 particles per orbit, which is slightly greater than the accretion rate onto the primary. The visualization shows the "ray-traced" simulation light curves as calculated for inclinations of 0 and 180 degrees (see Wood & Burke, 2007, ApJ, 661, 1042), and shows these are out of phase with each other. The line of nodes is shown as a blue bar, and precesses in the retrograde direction. The primary source of the negative superhump signal is the sweeping of the bright spot across the face of the disk, but simulations with dM/dt(L1) = 0 particles/orbit demonstrate that torques on the disk also contribute to the signal. I include a processed brown-noise effect whose volume tracks the i=0o light curve brightness.
Simulation details: Click Here to View
- ~100,000 particles in disk
- Orbits 400-403
- Mdot(L1) = 1000/orbit
- q = 0.40
At A&M-Commerce we've been running smoothed particle hydrodynamics (SPH) simulations of CVs with up to 250,000 particles. Here we present visualizations of the simulations. We originally put up "The Superhump Movie" which is a Quicktime movie of a full superhump precession cycle. The animation was generated from our smoothed particle hydrodynamics (SPH) code, visualized using IDL, and then animated using Adobe Premier. It's a 42MB file, so you'll need to have a high-bandwidth connection to download it, and I suggest you download and save it to disk for independent playback instead of trying to play it within your browser.
Simulation Details
Orbits: 61-96
Number of particles: 50 000
Mass ratio: q = M2/M1 = 0.075
I added a sound track that demonstrates the "beat" of the superhump oscillation period with the orbital period. Once per superhump period, there is a sound like an ocean wave (appropriate!). Notice that it begins at orbit 61 with the beep leading the wave sound, they are coincident at orbit 77, and the wave gets progressively later until the end of the simulation. If you watch closely, you can all see the precession of the superhump oscillation over the length of the animation.
- The Superhump Movie (2002)(42 MB) The audio track demonstrates beating between superhump and orbital periods (42 MB)
The following simulations use the same original data, but we've gotten a bit better in our visualization. Most importantly, you now can see the particles color-coded by their 'luminosity' over the previous time step, where we're assuming that the viscous dissipation energy is proportional to the luminosity. Our simulation light curves are a good match to the observed light curves, so this is likely to be a good assumption. The 'white' particles are the bright ones, and really demonstrate the location of the superhump light source. Notice in particular that the spiral arms are not fixed, but advance ~180 degrees every orbit (actually every superhump period), so that the arms alternate in their interaction with the rotating tidal field of the secondary star. Notice also that the major brightening (superhump pulse) is followed by a smaller pulse from the opposite arm - this is the source of the double-humped light curves which are commonly observed. This also accounts for the increasing harmonic complexity of the light curves and Fourier transforms as the system inclination increases.
- Building a disk to superhumps color -> luminosity (QT 15 MB)
- One orbit of Superhumps color -> luminosity (QT 12.3 MB)
- 10 orbits of Superhumps, i=75 deg color -> luminosity (avi 92 MB)
- 360-degree disk rotation in inclination color -> density (40 MB)
The '10 orbits of Superhumps' file has a soundtrack of music "Bass Station Alpha" that I wrote and performed. See my music page for the full track and other songs.